Between 1982 and 1990, 115 miles of carpool lanes have been constructed in Santa Clara County. Yet, the market share of HOVs fell from 17% to 12.5% of commute trips between 1980 and 1990 (even using the phony definition of only one passenger in the vehicle as an HOV), according to a recent County working paper. The absolute number of carpoolers also dropped. In the meantime, both the market share of solodriving and the absolute number of solodrivers has increased.
How can this be? An analysis of two roads shows the underlying problem.
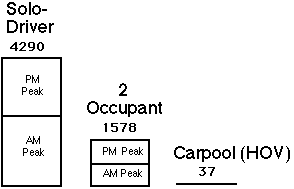
In both cases (San Tomas Expressway and Rt. 237), the number of lanes were increased from 4 to 6, increasing car carrying capacity by 50%. Data taken by counting vehicles show the results of these lane additions: HOV vehicles were negligibly increased compared with solodrivers (see graph). If it is hard to comprehend how solo-drivers are increased by constructing HOV lanes, visualize the following: Upon constructing the HOV lane, all the HOVs move over to the newly constructed HOV lane. This creates a vacuum in the other lanes that is filled by solodrivers. The increase in HOVs was negligible compared to the increase in solodrivers.

Increase in Vehicles resulting from adding HOV lanes, San Tomas Expressway (Santa Clara County).3 Vehicle counts in the peak commute direction were taken before and two years after increasing the lanes from 4 to 6. Data from Santa Clara County Transportation Agency. The increase in 2-Occupant does not mean a switch from solodriving as much as a switch from driving parallel routes to the less congested HOV lane, thus decreasing 2-Occupant on paralleling routes. When this figure was made, the definition of HOV nationally was at least three occupants.
In fact, calculating the market share of total vehicles on these roadways, constructing HOV lanes actually decreased the market share of HOVs. This number is different than the market share of HOVs for the county as a whole, described above, and is even more astounding. By any kind of business analysis, if an investment is made to increase market share, and by spending the money for the investment, the market share decreases, the investment is unquestionably a colossal failure. Yet, the County traffic engineers sent out a press release stating that HOV lane construction was "a great success". They statement is based on 1) re-defining the definition of HOV to include vehicles with one passenger (e.g., someone driving their spouse to work), and 2) ignoring the fact that whenever roadway capacity is increased by 50% in a congested corridor, you have to expect that, with time, you will get a 50% increase in vehicles. They never-ever mentioned the increase in solodrivers (37% in two years), just the fact that there was an increase in HOVs (29.6%).
This is just another example of traffic engineers' distorting actual facts for their self-serving vested interest: creating propaganda for more and more road construction (their main livelihood). Someone reading the newspaper, without more information, might erroneously agree that "29.6% increase in HOVs" is a great success. The reader might not realize that almost all of these, like the solo-drivers which were not even mentioned, came from paralleling roads (the immediate effect), and an increase in Vehicle-Miles-Travelled resulting from the decrease in travel time (see graph Relationship between vehicles and travel time for this long-term effect). Very few came from actually switching from solo-driving to carpooling (the unsubstantiated claim of the traffic engineers).
In terms of percentages, the following is calculated: Solo drivers increased by 23%(AM) and 30% (PM) on Rt. 237 only 9 months after adding HOV lanes. On San Tomas Expwy., the increase is 34% (AM) and 40% (PM), approx. 2 years after adding HOV lanes. Constructing HOV lanes is a solo driver incentive in disguise.
Another performance criteria is market share. (Market share is defined as the percent of total vehicles). The increase in market share for HOVs after adding the HOV lanes is small: 5% for San Tomas Expwy. and 6% for Rt. 237. However, it can be argued that this increase mostly resulted from cars switching from paralleling routes that do not have HOV lanes, and not cars switching from solo driving. The market share now varies between 16% and 23%. However, Santa Clara County classifies as HOV a car with merely two (or more) persons in a vehicle, contrary to almost all other locations.
The market share for 3+ HOVs [3 or more persons] actually decreased for San Tomas! It was 0.91% of vehicles. It is now 0.84%. Therefore, HOV lanes have not been successfull as HOVs are usually defined.
The data are given as the recent Vehicle Count minus Vehicle Count prior to HOV lane construction equals Increase in Vehicles. All figures are working day averages in the peak direction. Solo driver vehicles greatly outnumber HOV vehicles. In terms of persons carried, the increase in solo drivers still outnumber the increase in carpoolers in 3 out of 4 cases. The vehicle counts were taken by Caltrans for Rt. 237 and S.C.C.T.A. for San Thomas Expwy.
|
Solo Driver |
HOV |
||
|
Rt. 237 AM |
8692-6681= 2011 |
1908-919 = 989 |
|
|
Rt. 237 PM |
7517-6135= 1382 |
2283-1265= 1018 |
|
Solo Driver |
2 Occupant HOV |
3+ HOV |
|
|
San Tomas AM |
7536-5400= 2136 |
1366-547= 819 |
57-34= 23 |
|
San Tomas PM |
8483-6329= 2154 |
1653-894= 759 |
105-91= 14 |